Statistics Results
The Statistics Results dialog is composed of the following tabs:
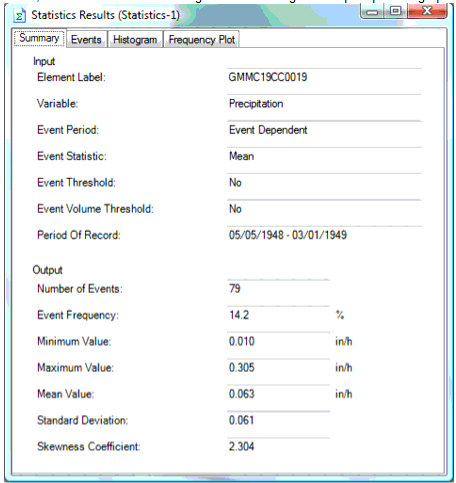
- Summary: The Summary tab shows the Statistics selection input and statistics results. Input data include Object Name, Variable, Event Period, Event Statistic, Event Threshold and Period of Record. Statistics results include Number of Events, Event Frequency, Minimum Value, Maximum Value, Mean Value, Std. Deviation and Skewness Coefficient. In the example below, there were 79 events during the model run given the precipitation graph below.

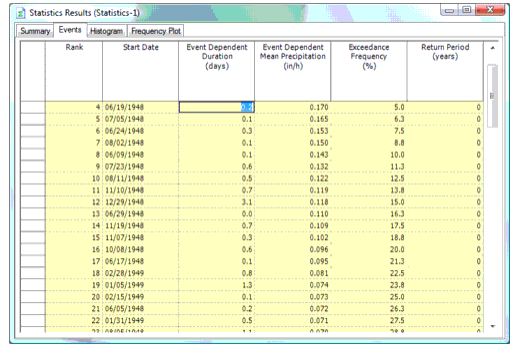
- Events: The Events tab shows a table of rank-ordered event periods, including their date, duration, and magnitude ranked according to the mean precipitation intensity.
- Histogram: The Histogram tab displays a plot of the occurrence frequency versus event magnitude.

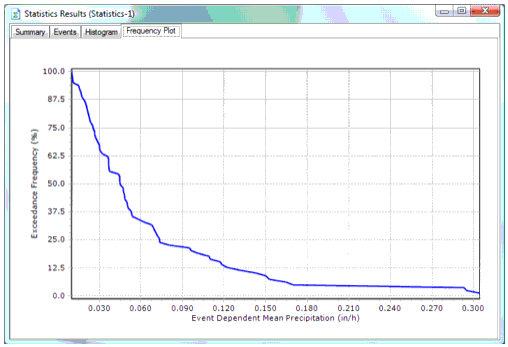
- Frequency Plot: The Frequency Plot tab displays the exceedance frequency of the event values. In the example, below50% of the events had a mean precipitation intensity greater than roughly 0.045.